
As one of the largest industries in the US (and the world), the construction market remains lucrative. Beyond the coronavirus-induced hiccups that hit the industry in early 2020, the US construction industry is constantly changing and adjusting to new economic climates around the globe. Construction statistics from 2022 show that there is not only a lot of growth in the market — but also increased risks.
Today, construction data is an invaluable asset for contractors that can assist them in their decision-making — from preconstruction to collecting payment. Construction statistics are changing how suppliers, subcontractors, and general contractors budget, schedule projects, bid, measure success with key performance indicators (KPIs), and more.
Contractors may also utilize construction statistics to make educated decisions regarding their business’ future, such as with productivity or with mapping out preconstruction. Risk assessment is also made clearer for contractors with access to construction statistics.
One such risk is the payment processes of the construction industry, which have become a focal point of research in recent years.
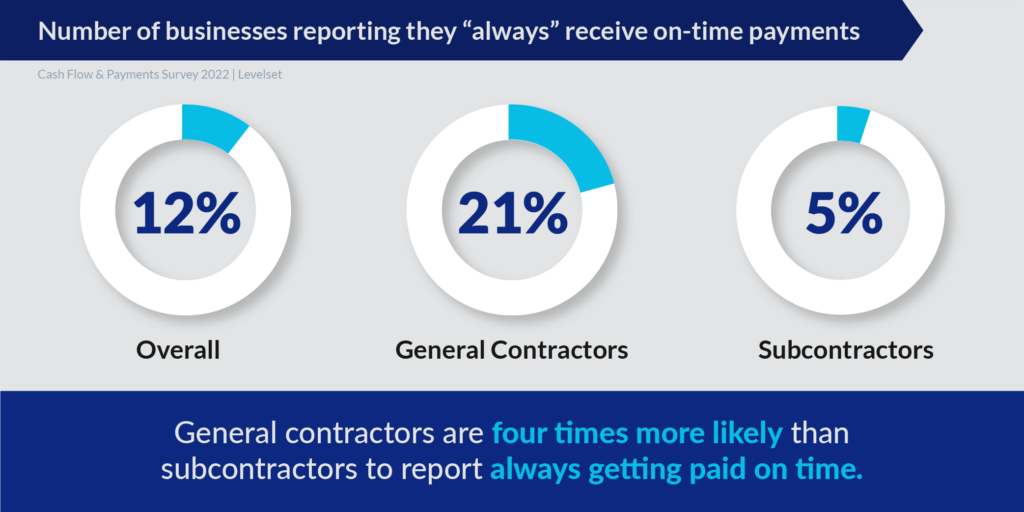
As published in the 2022 Construction Cash Flow & Payment Report conducted in Quarter 1 of 2022, a survey of 519 construction professionals found that just 12% of construction companies report always getting paid on time, with fewer than half that offer 30-day payment terms actually getting paid within that time frame.
Below are some key construction categories with recent statistics that shed light on the state of the industry in the US, the workforce that powers it, and payment standards. These statistics not only provide a current outlook for construction, but also future trends for the industry.
The US construction industry at a glance
In 2022, the US construction industry was worth $2.1 trillion based on gross output.1
As of 2020, the construction industry has 680,000+ employers and 7 million employees2 — this is a decrease from 2018, where there were 11.2 million construction employees.3
As of January 2020, over 50% of US contractors expected profit increases within a six-month timeframe. Over the tumultuous course of 2020, confidence reached “historic lows” in April of 2020, but as of the October 2020 report, it has continued to rebound.4
Construction spending data
US construction spending totaled $1.6 trillion in 2021.10
- Average US total construction spending totaled $1.18 trillion between 2011 and 2021.10
- US private sector construction spending totaled $1.25 trillion U.S. in 2021.10
- US public sector construction spending totaled $346 billion U.S. in 2021.10
- US commercial construction spending totaled $97 billion in 2022.11
- US single-family residential construction spending totaled $404 billion in 2022.11
- FMI forecasts spending to reach $415 billion by 2023, an increase of 3%.11
- US multifamily residential construction spending totaled $119 billion in 2022.11
- FMI forecasted spending to reach $123 billion by 2023, an increase of 4%.
- In 2021, the construction industry accounted for 4.2% of the US GDP.13
States with the most construction spending* in 2021
- Texas – $51 billion
- New York – $30 billion
- California – $23 billion
- Florida – $22 billion
- Arizona – $14 billion
States with the least construction spending* in 2021
- Alaska – $190 million
- Vermont – $295 million
- Wyoming – $357 million
- Hawaii – $531 million
- West Virginia – $533 million
*Private, non-residential spending12
Building Material Costs
With a global supply chain squeeze and pre-recession inflation, prices of materials have skyrocketed across the board at various times. While many have come down from their peak prices, the overall numbers have largely ended up at a net increase from January to November of 2022, with the exception of lumber prices.24
Cement prices
- Cement bag prices increased 17.8%
- Concrete cinder block prices increased by 53.8%
Lumber prices
- Untreated dimensional lumber prices decreased by 33.7%
- Treated dimensional lumber prices decreased by 39.2%
- Untreated plywood prices decreased by 20.4%
- Treated plywood prices decreased by 3.93%
Metal prices
- Steel stud prices increased by 20.7%
- Steel rebar prices increased by 25.8%
- Steel panel prices increased by 2.19%
- Aluminum angle prices increased by 34.7%
Miscellaneous prices
- Asphalt shingles prices increased by 6.02%
- R-19 fiberglass insulation prices increased by 12.1%
- R-13 fiberglass insulation prices increased by 26.7%
- Drywall prices increased by 12.9%
- Mold-resistant drywall prices increased by 17.4%
Credit and payments in construction
Only 12% of contractors in 2022 say they “always” get paid on time according to terms in their contract.29
29% of contractors in 2022 say it takes between 30-40 days to receive payment after invoicing and 21% say it takes between 41-60 days.29
The median DSO in the construction/engineering industry was 90 days in 2019.15
Only 15% of construction businesses were always paid in full in 2022.29
75% of contractors in 2022 say they’ve had retainage withheld from payments on one or more projects.29

Mechanics liens: In a 2022 survey of 519 contractors, 51% of contractors stated they’ve tried filing a mechanics lien to get paid.30
Construction disputes
North America’s average length of construction disputes was 16.7 months and average value of construction disputes was $30.1 million in 2021.14
The same study cites contract and specification reviews as the most common method of construction alternative dispute resolution that year.
The most common construction dispute cause was listed as “poorly drafted or incomplete and unsubstantiated claims” in 2021.14
Construction business
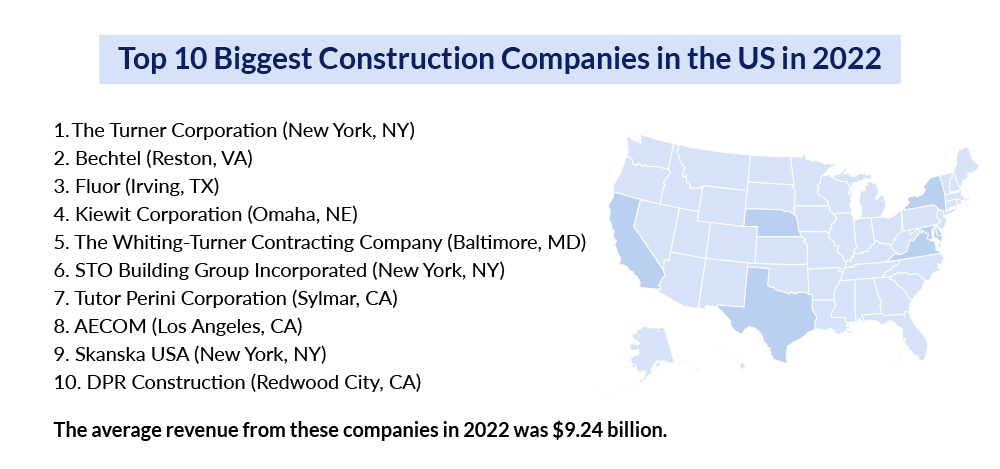
Top 10 Biggest Construction Companies in the US in 2022:17
- The Turner Corporation (New York, NY) – $14.4B
- Bechtel (Reston, VA) – $12.2B
- Fluor (Irving, TX) – $11.7B
- Kiewit Corporation (Omaha, NE) – $11.2B
- The Whiting-Turner Contracting Company (Baltimore, MD) – $8.7B
- STO Building Group Incorporated (New York, NY) – $8.1B
- Tutor Perini Corporation (Sylmar, CA) – $6.6B
- AECOM (Los Angeles, CA) – $6.6B
- Skanska USA (New York, NY) – $6.5B
- DPR Construction (Redwood City, CA) – $6.5B
The average revenue from these companies in 2022 was $9.24 billion.17
- The average gross profit margin in the construction industry was 28.62% in Quarter 3 of 2022 (data calculated only using publicly-traded construction companies).16
- The construction industry net margin was 10.06% in Quarter 3 of 2022 (data calculated only using publicly-traded construction companies).16
- The average construction backlog is 9 months as of September 2022.18
Workforce statistics in construction
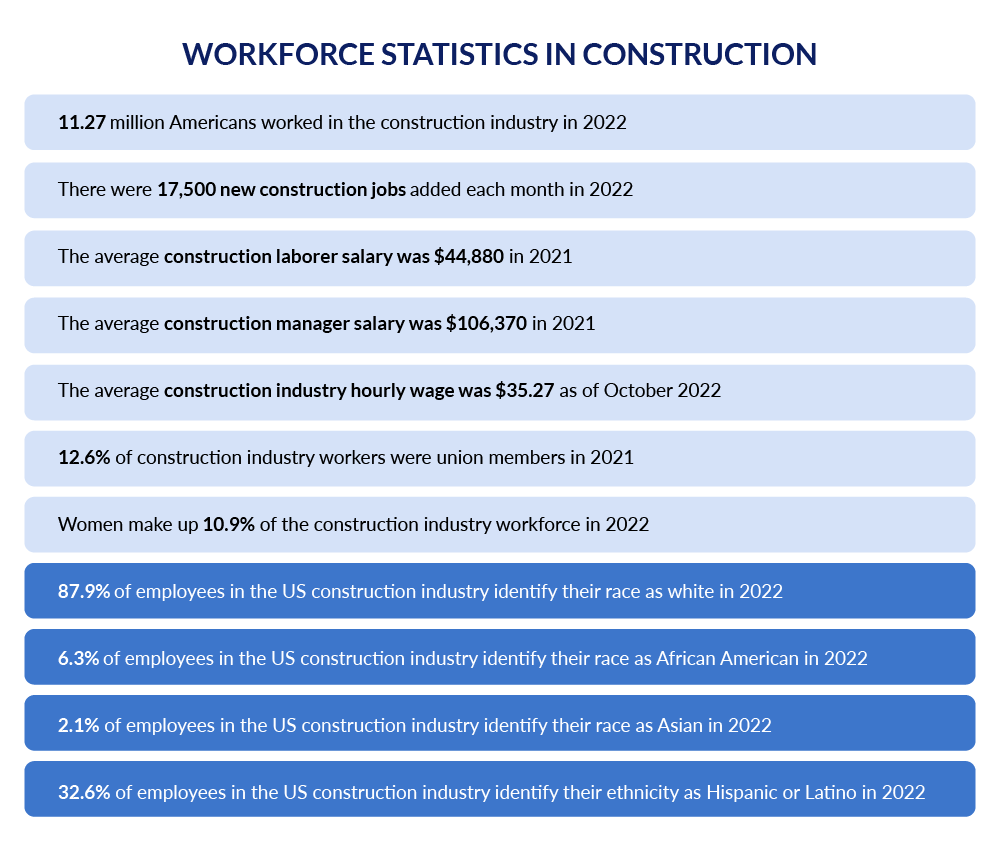
11.27 million Americans worked in the construction industry in 2022,19 and there were 17,500 new construction jobs added each month in 2022.21
Construction industry jobs and salaries
- The average construction laborer salary was $44,880 in 2021.20
- The average construction manager salary was $106,370 in 2021.20
- The average construction industry hourly wage was $35.27 as of October 2022.20
Who works in the construction industry?
- 12.6% of construction industry workers were union members in 2021.20
- Women make up 10.9% of the construction industry workforce in 2022.22
- 87.9% of employees in the US construction industry identify their race as white in 2022.19
- 6.3% of employees in the US construction industry identify their race as African American in 2022.19
- 2.1% of employees in the US construction industry identify their race as Asian in 2022.19
32.6% of employees in the US construction industry identify their ethnicity as Hispanic or Latino in 2022.19
Safety statistics in construction
Fatalities
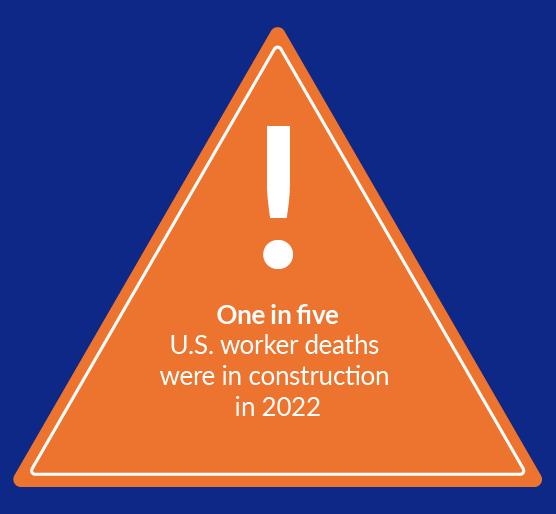
- 21.2% of worker fatalities in the U.S. came from the construction industry in 2020.23
- 1008 construction worker deaths in private industry (2020).23
- The construction industry accounted for 46.1% of all fatal falls, slips, and trips in 202031
- Top causes of death in construction (2020)32
- 1. Falls: 36.5% of construction deaths were caused by falls.
- 2. Falling objects: 15.2% of construction deaths caused by falling objects.
- 3. Electrocution: 5.2% of construction deaths caused by electrocution.
- 4. Caught-in/Compressed by equipment: 2.7% of construction deaths caused by workers caught-in or compressed by equipment or objects.
OSHA Violations
- 5,465 fall protection violations worth $28.8m in penalties in 202125
- 2,096 ladder violations worth $5.7m in penalties in 202125
- 2047 scaffolding violations worth $2.9m in penalties in 202125
- 1687 fall protection training violations worth $2.9m in penalties in 202125
- 1494 eye and face protection violations worth $4.8m in penalties in 202125
- 863 health and safety violations worth $3.5m in penalties in 202125
- 841 head protection violations worth $2.4m in penalties in 202125
- 549 excavation safety requirements violations worth $2.5m in penalties in 202125
- 534 aerial lifts violations worth $1.7m in penalties in 202125
- 531 hazard communication violations worth $610k in penalties in 202125
Read more: OSHA’s top construction violations and how to prevent them
Top five construction associations: By the numbers
- Associated General Contractors of America7
- 89 chapters across the US
- 6,500+ US general contractors represented
- 9,000+ US subcontractors represented
- 10,500+ US suppliers represented
- 26,000+ total US contractors represented
- Associated Builders and Contractors26
- 21,000 merit shop construction and construction-related firms represented with 68 chapters
- Construction Management Association of America27
- 16,000 members
- Mechanical Contractors Association of America26
- 2,600+ members
- National Electrical Contractors Association26
- 174 chapters across the US
Citations
1 Bureau of Economic Analysis, Gross Output by Industry, 2020-2022
2 The Associated General Contractors of America, Construction Data
3 Statista, Number of employees in the U.S. construction industry from 2000 to 2018, March 2020
4 Associated Builders and Contractors, Construction Contractor Confidence Surges into 2020, January 2020
5 Turner & Townsend, International construction market survey 2019
6 Statista, Global construction equipment unit sales between 2018 and 2022, by region, May 2020
7 Associated General Contractors of America
8 Statistia, Construction industry spending worldwide from 2014 to 2025, August 2019
9 Frost & Sullivan, Global Spending in Construction to Reach $17.5 Trillion by 2030, Finds Frost & Sullivan, December 2019
10 Statistia, Construction spending in the United States from 1998 to 2019, by sector, March 2020
11 FMI Consulting, 2020 FMI Overview Featuring FMI’s Fourth Quarter 2019 Outlook
12 Census.gov, Annual Value of Private Nonresidential Construction Put in Place by State, 2008-2021
14 Arcadis, 2022 Global Construction Disputes Report
15 PWC, Working Capital Report 2019/20: Creating value through working capital
16 CSI Market, Construction Services Industry Profitability
17 Levelset, The 10 Biggest Construction Companies in the U.S. in 2022
18 Associated Builders and Contractors, ABC’s Construction Backlog Indicator Jumps in September; Contractor Confidence Remains Steady
19 Bureau of Labor Statistics, Employed persons by detailed industry, sex, race, and Hispanic or Latino ethnicity, 2021
20 Bureau of Labor Statistics, Industries at a Glance: Construction
21 Bureau of Labor Statistics, Current Employment Statistics Highlights, January 2020
22 Bureau of Labor Statistics, Women in the labor force: a databook, December 2019
23 Bureau of Labor Statistics, Fatal occupational injuries for selected industries, 2016-20
24 Levelset, Construction Materials Price Tracker
25 Levelset, Top OSHA Violations in Construction (2021)
26 Eastern Michigan University Library, Construction Management: Construction Associations
27 CMAA, About Us
28 NAWIC
29 Levelset, 2020 National Construction Payment Report
30 Levelset, 2022 Construction Cash Flow & Payment Report
31 Bureau of Labor Statistics, A look at falls, slips, and trips in the construction industry (2020)
32 Bureau of Labor Statistics, Fatal occupational injuries by event or exposure for all fatal injuries and major private industry sector, all United States, 2020