
— 13 min read
Guide to S-Curve Modeling in Construction
Last Updated Feb 22, 2024

Navigating the intricacies of construction projects requires meticulous planning, resource allocation and monitoring to ensure success. In this fast-paced and dynamic industry where time and resources are often at a premium, project managers and stakeholders need robust tools to monitor project performance and streamline their decision-making processes. S-curve modeling has emerged as a practical and indispensable technique in construction project management.
In this article, we delve into S-curve modeling in construction, examining its real-world applications, benefits and impact on the practical aspects of construction project planning, execution, and optimization.
Contents
Table of contents
What is S-curve modeling?
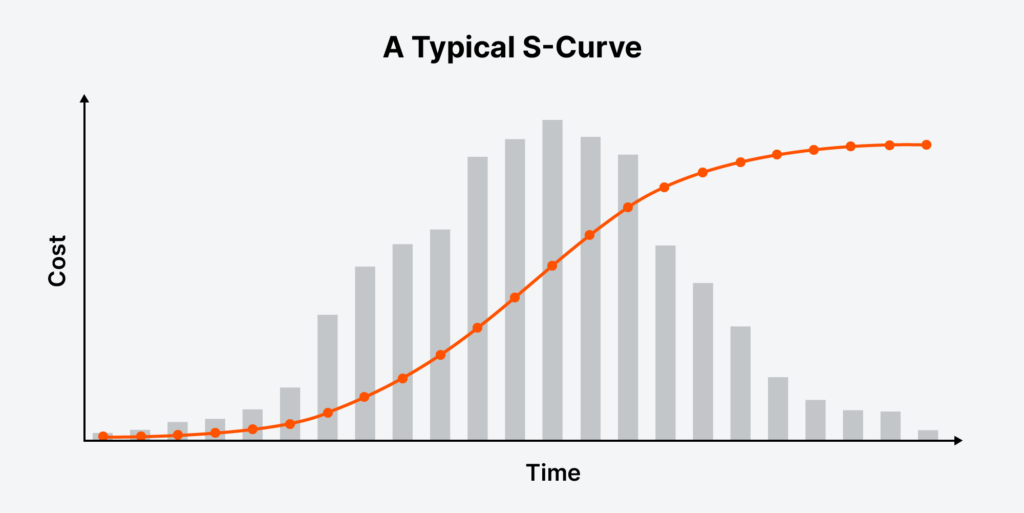
The S-curve is a graphical tool that represents cumulative progress over time. It typically charts planned progress, actual progress and sometimes forecasts future progress. Named after its distinctive "S" shape, which mirrors the typical pattern of construction projects — beginning slowly, transitioning into period of rapid progress in the middle, and gradually slowing down as closeout approaches — S-curves provide a valuable insight into project dynamics.
S-Curve Modeling: The Basics
The S-curve is a graphical representation that depicts the cumulative progression of a project over time. The "S" shape effectively captures the cumulative work or costs over the project's lifespan and reflects the typical pace at which projects advance: slow at the beginning, accelerating in the middle, and tapering off toward the end.
Components of an S-Curve
The S-curve can be segmented into four distinct phases, each representing a critical stage of the project’s life cycle:
- Initiation Phase: This initial stage represents the beginning of the project, where work commences gradually — the site is being set up and resources are being mobilized. The curve here is relatively flat, reflecting the slow rate of progression and expenditure.
- Growth Phase: After the initiation, the project enters the growth phase, characterized by a rapid increase in project activities. It's a period of significant resource allocation where the majority of the physical construction takes place. The slope of the S-curve during this phase is steep, representing a substantial commitment of labor, materials, and costs as the project picks up speed.
- Maturity Phase: As the project progresses, the pace stabilizes, leading to the maturity phase. The rate of expenditure and resource allocation begins to plateau and the S-curve reflects this by showing a gradual leveling out. This phase indicates moving consistently towards project completion, with the curve's slope easing off as the project hits its key milestones and approaches its goals.
- Decline Phase: In the final phase, activities start to wind down, and the curve flattens out once again at the top. The remaining tasks are completed, and the project moves towards closeout with expenses and labor hours decreasing.
How to Calculate an S-Curve
Calculating an S-curve for a construction project involves gathering data, plotting it in a cumulative fashion and using it to visualize the project's progression over time.
1. Define the parameters.
Begin by establishing the core parameters of the project including:
- Project Duration: The total time from the start to the end of the project.
- Total Budget or Quantity: The total cost or the total quantity of work to be done.
These parameters delineate the scope of what will be monitored by the S-curve model.
2. Collect the data.
Collect the project's financial and operational data. Segment the total budget or quantity into a time-phased budget, dividing it into regular intervals like weeks or months. This breakdown will serve as the foundation for the S-curve, providing a structured timeline of when and how resources will be allocated over the course of the project.
3. Plot the planned value (PV).
Create a graph with time on the horizontal axis and cumulative cost or work on the vertical axis. Starting at the beginning and plot the cumulative PV at each time interval. This plotted PV captures the entirety of the expected project costs or work volume over time. This S-curve illustrates the planned progression of the project, which serves as a baseline to measure actual performance against projected expectations.
4. Track actual progress.
As the project progresses, record the Actual Cost (AC), or the actual expenditure, and the Earned Value (EV), the value of the work completed. Plot both the AC and the EV on the graph as well, which will result in two additional curves that may diverge from the planned S-curve.
5. Analyze the S-curves.
Use the different S-curves (PV, AC, and EV) to analyze your project's health and trajectory. A side-by-side comparison of these curves can indicate whether the project is on schedule and within budget. Furthermore, the steepness of the S-curve at different points can provide information about the rate of progress; a steeper curve suggests a faster rate of work.
6. Adjust and update.
As your project unfolds, it's crucial to regularly revise the S-curve with updated Actual Cost (AC) and Earned Value (EV) data. Should the project diverge from its initial plan due to unforeseen circumstances or necessary scope adjustments, recalibrating the S-curve is imperative to maintain its accuracy as a project management tool. Furthermore, utilize the insights gained to make informed decisions about resource allocation, schedule adjustments, and other management actions.
While S-curves can be charted by hand or constructed manually using spreadsheets, advanced project management software can aid in simplifying the creation and adjustment of sophisticated S-curves, providing real-time adaptability to the changing dynamics of a project. These tools can facilitate instantaneous updates to the S-curve based on new data, enabling project stakeholders to swiftly respond to shifts in project timelines, costs or resource allocation. With this technology, construction firms can create S-curves that remain an up-to-date reflection of the project's status, allowing for proactive management and strategic foresight throughout the project lifecycle.
Types of S-Curves
S-curves are used for a variety of purposes and can generally be categorized into two main types: financial and project management.
Financial S-Curves
- Budget cost S-curve: Charts the financial distribution over the project's life.
- Actual cost S-curve: Tracks the actual expenditures against the budget.
- Cash outflow S-curve: Forecasts when and how much money will be spent.
- Cash inflow S-curve: Monitors incoming payments from clients, particularly in projects with phased billing.
- Revenue S-curve: Tracks incoming revenue against time.
- Profit margin S-curve: Assesses profitability by comparing revenue with project costs over time.
Project Management S-Curves
- Baseline schedule S-curve: Shows the planned project timeline and major milestones.
- Actual progress S-curve: Compares actual work completed to the baseline schedule.
- Labor hour S-curve: Plots labor allocation and utilization against the project timeline.
- Material delivery S-curve: Tracks material supplies and when they are received as per the project schedule.
- Earned value S-curve: Integrates cost and schedule to provide an overall view of project performance.
- Productivity S-curve: Evaluates how efficiently resources are converted into project deliverables.
- Inspection S-curve: Plans and tracks the completion of quality inspections throughout the project.
- Defects density S-curve: Monitors the occurrence of defects over time to manage quality assurance.
- Safety incident S-curve: Records and analyzes the frequency and severity of safety incidents to improve workplace safety practices.
Financial S-curves are focused on the monetary aspects of the project, providing insight into budgeting, spending, and financial forecasting. Project management S-curves, on the other hand, are geared toward operational metrics, such as schedule adherence, resource utilization, performance efficiency, quality control, and safety management.
Both financial and project management S-curves provide a visual and analytical method to gauge different dimensions of a project's health. They are often used in conjunction, offering a multi-faceted view that encompasses both the financial and operational statuses of a project. Understanding and utilizing the appropriate type of S-curve for the specific needs of a project is a key skill for effective project management.
Analysis of S-Curve Examples
In the realm of construction project management, S-curves are more than just charts -- they are narratives that tell the story of a project's health and performance. By carefully examining these curves, project managers can decode a wealth of information about the trajectory and well-being of their projects. They reveal whether the project is on track financially, if the schedule is being adhered to, how effectively resources are being deployed, and much more.
Let's delve into some illustrative examples of S-curves in construction and explore the insights they provide, demonstrating their indispensable role in guiding projects to successful completion.
Actual Earnings Ahead of Plan
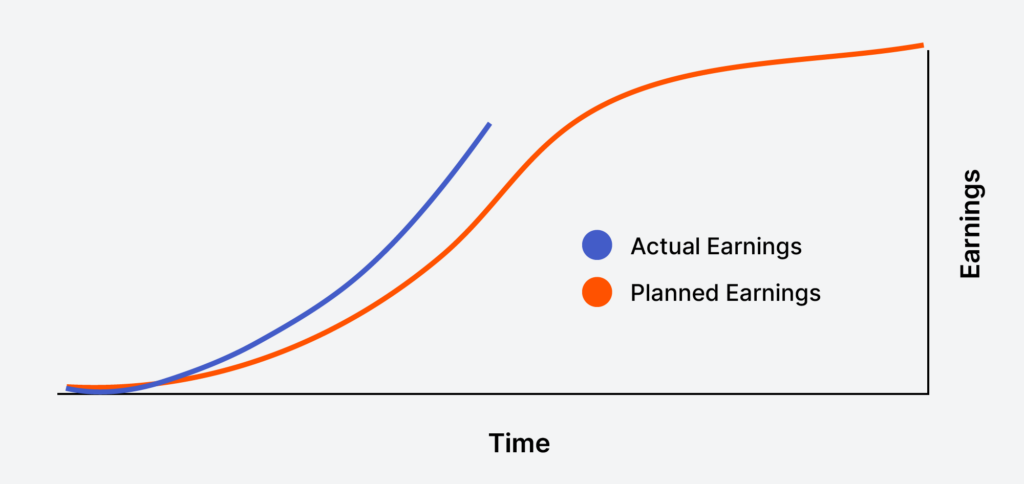
In the example above, the S-curve tracking actual earnings shows that the project is about halfway done. It's clear that the actual progress curve is accelerating at a more rapid pace than the planned progress curve. This suggests that the project is advancing more quickly than expected, achieving milestones earlier and thus, operating ahead of its scheduled plan.
Actual Earnings Lagging Behind Plan
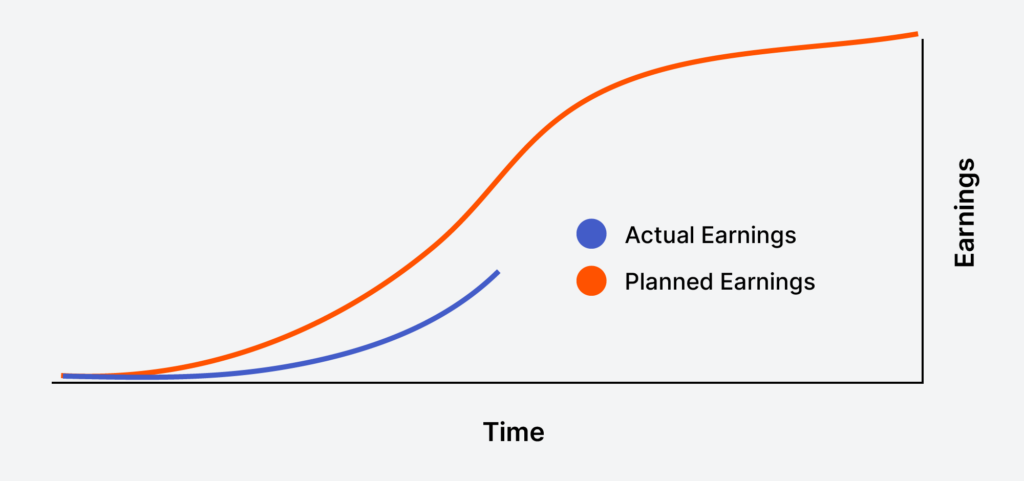
In this example, the actual earnings appear to the right of the planned earnings. This positioning indicates that the earnings have been realized later than initially projected, suggesting that the project is lagging behind the anticipated schedule.
Acceleration in Actual Earnings
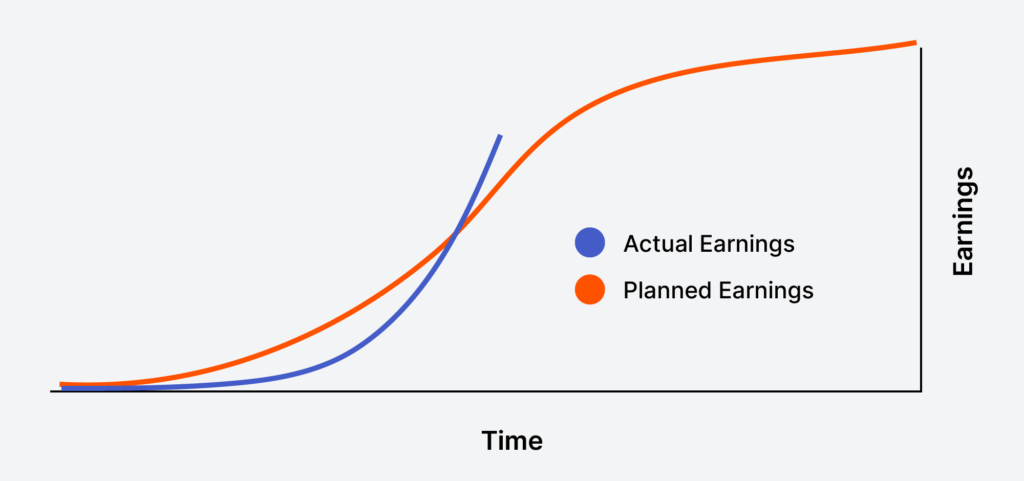
This s-curve shows that in the initial stages of the project the actual progress lagged behind the planned progress, signaling a delay in project kickoff. Subsequently, the actual curve experienced a sharp incline and overtook the planned curve. This suggests that although the project kicked off with a slower pace, it managed to accelerate swiftly and has now surpassed the planned milestones, putting it ahead of the original schedule.
Front-Loaded S-Curve
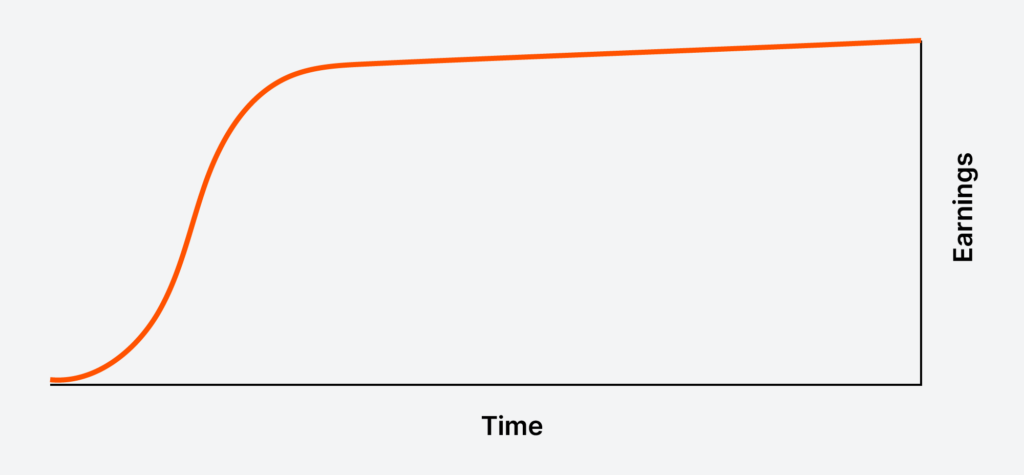
On a project where significant costs are incurred in the early stages of the project, the S-curve will be front-loaded. This could arise from strategies such as cost front-loading, which may involve early procurement of materials to capitalize on lower prices or due to long lead-times, addressing the intricacies of a complex project, or adhering to specific client requirements. Alternatively, it could stem from a condensed start-up period or project planning phase. Another possibility is that the project schedule was intentionally accelerated from the outset to deliver the project more quickly.
Back-Loaded S-Curve
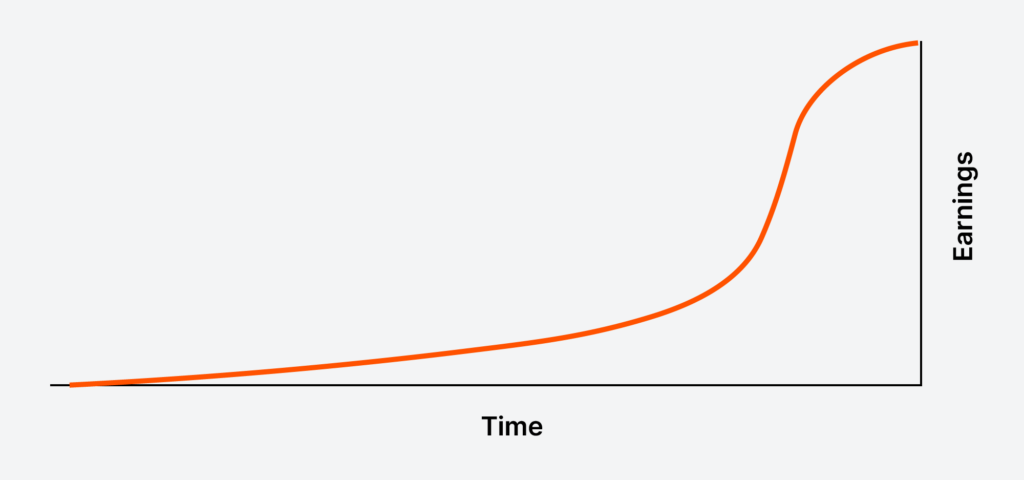
Some projects maintain low costs throughout the majority of its timeline, with expenses escalating only toward the end. This back-loaded S-curve often occurs when there's an extended planning or design phase that incurs minimal costs in comparison to the later construction period. Additionally, it could reflect a procurement strategy where high-value items have long lead times and are scheduled for delivery and installation closer to the project's completion.
How S-Curves are Used in Construction
S-curve modeling in construction is a multifaceted tool that is deeply integrated into various stages of project management, from initial planning to final execution. Here's a more detailed look at how S-curves are utilized in construction:
Initial Project Planning
- Budgeting and financial planning: In the early planning stages, S-curves are used to estimate the financial aspects of the work over the project's timeline, helping in setting up a budget that reflects the expected expenditure pattern.
- Scheduling: S-curves also assist in forecasting the project timeline, by showing the expected rate of progress at different stages, thus aiding in setting realistic milestones and deadlines.
Resource Allocation and Scheduling
- Labor and material management: By predicting the phases of the project where resource utilization will be at its peak, S-curve models enable efficient resource allocation and scheduling of labor and materials, thus optimizing costs and reducing wastage.This also helps in identifying and mitigating potential bottlenecks early on.
- Dynamic rescheduling: As the project progresses, S-curves can be adjusted to reflect changes, helping in rescheduling resources as needed.
Performance Monitoring and Control
- Tracking progress: During the execution phase, S-curves provide a visual representation of planned vs. actual progress, allowing project stakeholders to quickly identify areas lagging behind schedule.
- Cost control: By continuously comparing the actual costs with the planned budget as depicted by the S-curve, project managers can keep a tight control on expenditures, identifying and addressing budget overruns in a timely manner.
Risk Management
- Predictive analysis: S-curves can be used for predictive analysis, providing early warnings of potential delays or budget overruns, allowing for proactive measures to be put into place to mitigate risks.
- Informed decision-making: The clear visual representation of project data provided by S-curves supports better decision-making, especially in complex scenarios involving multiple variables and stakeholders.
Stakeholder Communication
- Reporting: S-curves offer a straightforward and comprehensible way to report project progress to stakeholders, increasing understanding, transparency, and trust.
- Performance reviews: These models are also useful in performance reviews with clients, investors, or senior management, providing a quick visual overview of project status.
Post-Project Analysis
- Review and applying lessons learned: After project completion, analyzing the S-curves can offer insights into the accuracy of initial estimates, efficiency of resource utilization, and overall project management effectiveness, contributing to learning best practices for future projects.
Challenges and Limitations of S-Curve Modeling
S-curve modeling is a pivotal tool for forecasting and tracking project progress; however, its implementation is not without challenges and limitations that require strategic management and mitigation.
Implementing S-curve models in construction project management can be a complex task, with significant challenges lying in the acquisition of accurate and timely data, which is essential for the model's foundation. Additionally, the dynamic nature of construction necessitates ongoing adjustments to the S-curve, ensuring it mirrors the actual progress and current state of the project, highlighting any deviations from the initial plan.
To address these challenges, it is essential to implement strategies such as robust data collection and management systems, regular model updates to reflect the on-ground reality, and the use of probabilistic modeling techniques to account for uncertainties. Educating project teams on the nuances of S-curve modeling and encouraging their input in the model’s development can also improve reliability. Additionally, using historical data from past projects to inform current S-curve models can help in making more accurate projections.
Integrating S-Curves with Construction Management Tools
The incorporation of S-curve modeling into construction management software is a significant advancement in project planning and monitoring. There's a variety of construction management software available that enables the creation and manipulation of S-curves. These range from comprehensive project management suites to specialized analytics platforms. They often include features for inputting project data, such as timelines, resources, and work breakdown structures, which are then used to generate and update S-curves in real-time.
Modern construction management software is designed to be compatible with a range of project management methodologies as well as seamlessly integrate S-curve data with other resource management tools. This provides stakeholders with a multifaceted view of the project's progress and facilitates cross-methodology compatibility for a holistic perspective.
Furthermore, these software platforms provide a centralized database where all project-related information is stored, which means that the data used to create S-curves is consistent, up-to-date, and accurate. Features such as automatic data synchronization, cloud-based collaboration, and mobile accessibility ensure that the S-curve models reflect the true status of the project at any given moment. With real-time data tracking, S-curves act as a living model that adjusts as the project evolves, providing project managers with the ability to perform immediate analysis and make informed decisions.
By leveraging the capabilities of construction project management platforms, the S-curve becomes a more dynamic and practical tool, providing a reliable basis for planning, monitoring, and controlling construction project outcomes.
Categories:
Tags:
Written by
TJ Forbes
12 articles
TJ Forbes is a Senior Solutions Engineer at Procore, specializing in financials products, analytics, ERP integrations, workflows, reporting and accounting solutions. He previously worked as a financial manager and project accountant for Stiles, a commercial real estate firm in Ft. Lauderdale. TJ holds a Masters in Financial Management from Southern Adventist University.
View profileTaylor Riso
39 articles
Taylor Riso is a marketing professional with more than 10 years of experience in the construction industry. Skilled in content development and marketing strategies, she leverages her diverse experience to help professionals in the built environment. She currently resides in Portland, Oregon.
View profileExplore more helpful resources

Pro Forma Explained: How Construction Developers Predict Financial Success
Understanding the financial nuances of construction projects requires a deep dive into forecasting, planning and financial evaluation to determine a project’s success and profitability. In this challenging financial environment, pro...

How to Manage Cash Flow Throughout the Construction Lifecycle
Navigating the financial ebbs and flows of construction projects demands a deep understanding of how to manage cash flow. Cash flow management in construction is the practice of overseeing and...

Construction Cash Flow Projection: A Deep Dive into Financial Forecasting
Cash flow projection is instrumental in evaluating a project’s financial health and maintaining firm operational stability: These projections serve as a strategic roadmap for financial decision-making, helping to identify potential...

Contractor Financing: The Complete Guide
The financial success of a construction business depends largely on its ability to manage cash flow. Throughout a project, contractors face a significant outlay of cash for materials and other...