— 4 min read
PERT in Construction: Scheduling for Uncertainty
Last Updated May 30, 2025

Contractors with an array of planning tools and techniques are able to create more precise project timelines, customize preparation for each job and improve communication with owners and subcontractors. The Program Evaluation and Review Technique (PERT) is a method that, while not widely used in construction, can be effective at improving planning for a variety of tasks, milestones and projects.
PERT is commonly used to refer to two different but not mutually exclusive tools:
- A formula that can help establish probabilistic time estimates for tasks or projects, particularly those with a high degree of uncertainty
- A chart that can be used to represent probabilistic durations between project milestones
This article explores PERT, including when to use it, examples, and how it can complement and improve other planning tools and techniques.
Learn more: The Fundamentals of Scheduling in Construction
Table of contents
What is PERT?
Program Evaluation and Review Technique, or PERT, is a process used by construction project teams to provide an initial schedule for a complicated project. A PERT schedule is created before the start of the project.
The process starts by identifying tasks in the project and their durations. Then, calculations are performed to provide the team with the best estimate of the time required to complete each task. Project managers can then identify critical tasks that need to be completed on time to keep the project on schedule.
PERT Formula for Estimating Task Duration
PERT is a tool to help estimate task durations. Experienced contractors are usually able to accurately estimate the duration of most activities, either because they’ve done the task before or because they can reference when someone else did something similar.
However, the duration of some activities can still be difficult to forecast, especially when they’re part of a project that’s extremely unique or has a lot of uncertainty.
PERT uses a simple equation to calculate a probabilistic time estimate by creating a weighted average of three different time estimates:
- Optimistic Time (OT)
- Most Likely Time (MT)
- Pessimistic Time (PT)
Those times are plugged into the following formula, with additional weight given to the most likely time:
PERT Weighted Estimate = [OT + (4 * MT) + PT] ÷ 6
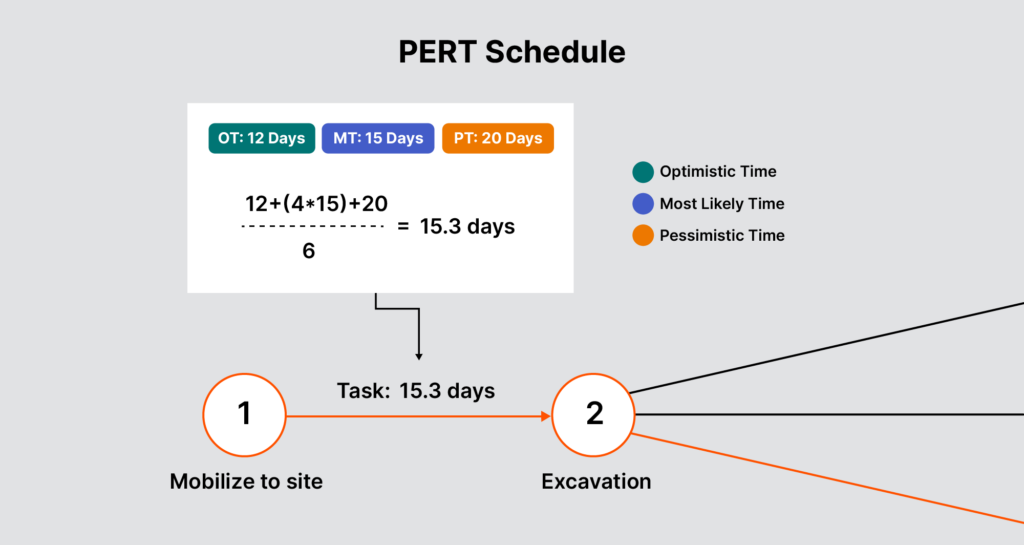
Here's an example: An old factory is being renovated to become an office building. Figuring out how long to plan for installing drywall is proving to be difficult, given the unique features of the building and layout of the space. The following time estimates for installing drywall are established:
- Optimistic Time: 12 days
- Most Likely Time: 15 days
- Pessimistic time: 20 days
According to the formula, the estimated duration is 15.3 days:
[12 + (4*15) + 20] ÷ 6 = 15.3
The estimate of 15.3 days is similar to the most likely time of 15 days, but is helpful because it suggests that an additional day should be allocated to complete the task.
How Construction PERT Charts Work
PERT charts are a visualization technique for showing the estimated duration between major project milestones. The chart sequences project milestones, connects them with arrows in the order they need to be done and shows the duration between two milestones. This type of chart is known as an activity-on-arrow.
The PERT chart shows milestones, which sets it apart from charts used with other planning techniques, such as the one used with the Critical Path Method (CPM), that look similar but are used to define and sequence tasks and activities in great detail.
When the duration between the milestones is unknown or uncertain, the PERT equation can be used. However, the chart is also useful when durations are known.
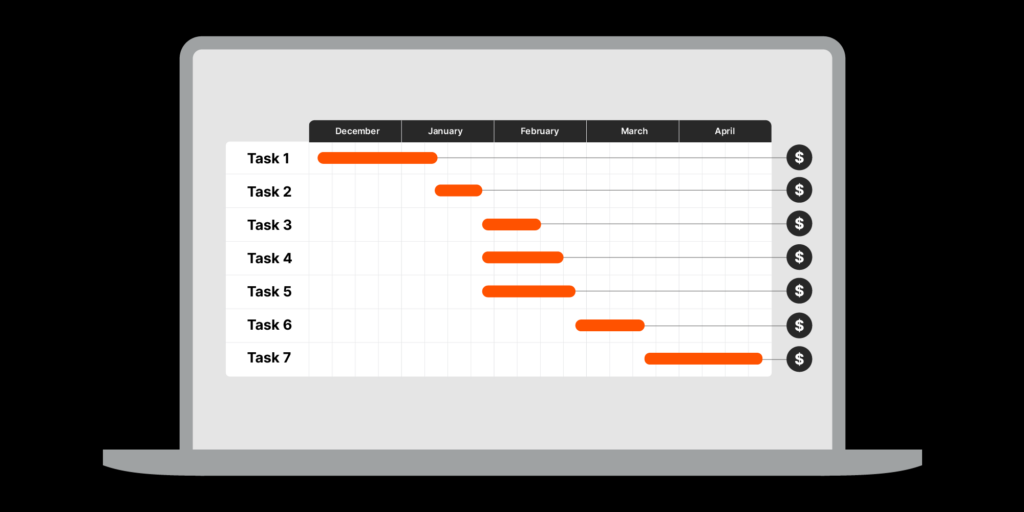
PERT charts can share project timelines with owners without giving excessively — and potentially confusing — detailed information. Additionally, milestones are often when payments are submitted or received, so the PERT chart can be used to help plan budgets and share information with subcontractors.
Dig Deeper: The Difference Between PERT & CPM
Example of a PERT Chart
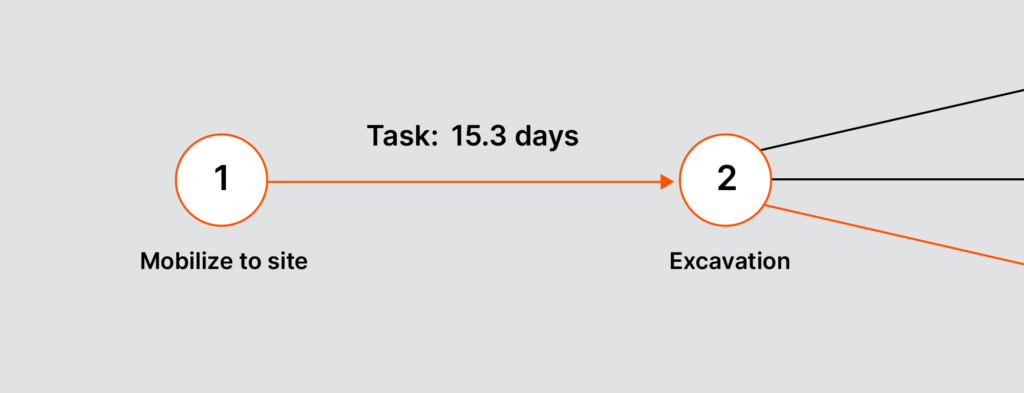
A contractor wants to share the sequence of milestones with the project’s owner. They create a PERT chart where the first milestones are “Mobilize to Site” and “Excavation.”
Because the duration of time between these two milestones is uncertain, the contractor uses the PERT equation to establish an estimate, shown above the arrow. This process could be continued for each milestone.
Stay updated on what’s happening in construction.
Subscribe to Blueprint, Procore’s free construction newsletter, to get content from industry experts delivered straight to your inbox.

Using PERT with Other Scheduling Methods
PERT can be used to complement or improve other planning methods. When using other tools and techniques, the PERT equation can be used to estimate the duration for tasks that are unknown or uncertain.
The full chart from the PERT chart example above uses red to highlight the critical path — which is the longest sequence of tasks that can’t be delayed without having to change the schedule — and is often found through the critical path method (CPM). The PERT chart, as opposed to the much more detailed chart used in CPM, can be a more effective big-picture tool to share with the owner.
Many contractors gain enough experience that accurately estimating the duration for most activities isn’t a challenge. However, PERT allows them to remain nimble and precise when faced with new or unknown tasks or projects.
Was this article helpful?
Thank you for your submission.
100%
0%
You voted that this article was . Was this a mistake? If so, change your vote here.
Scroll less, learn more about construction.
Subscribe to The Blueprint, Procore’s construction newsletter, to get content from industry experts delivered straight to your inbox.
By clicking this button, you agree to our Privacy Notice and Terms of Service.
Categories:
Tags:
Written by
Ben Ashburn
21 articles
Ben Ashburn is a Senior Construction Education Trainer at Procore. After a successful career as a construction estimator — working his way up from estimating manager to senior estimator — Ben has spent the most recent part of his career in construction sharing his skills with other as a construction educator. Ben has an extensive background in construction education: He has been an assistant professor in the Department of Construction Science at Texas A&M, and lectured about estimating, scheduling, management, and other related construction topics at Murray State University. He has been a construction training and learning development partner with Procore since 2019.
View profileJames Hamilton
71 articles
James Hamilton is a writer based in Brooklyn, New York with experience in television, documentaries, journalism, comedy, and podcasts. His work has been featured on VICE TV and on The Moth. James was a writer and narrator for the show, VICE News Tonight, where he won an Emmy Award and was nominated for a Peabody Award.
View profileExplore more helpful resources

Mastering Construction Resource Management: Strategies for Success
Completing construction projects successfully requires the careful management of various resources: labor, materials, equipment, money, time and information. Since these resources are finite, allocating them wisely is crucial for minimizing...
Cost-Loaded Construction Schedule: Analysis, Risks & Benefits
Both scheduling and cost control are make-or-break aspects of construction projects, but in many cases the two areas are kept very separate from one another — the project scheduler and...

Understanding the Last Planner System in Construction
Construction scheduling is a complex process affecting multiple stakeholders. Increasing accuracy and collaboration with trade partners when scheduling construction work can positively impact on-site workflow and efficiency. The last planner...

Forensic Schedule Analysis: Unlocking Insight Into Project Delays
Though construction sites may sometimes look like a large collection of machines, ultimately, it’s people who get things built. However, people aren’t perfect, and delays happen all the time —...
Free Tools
Calculators
Use our calculators to estimate the cost of construction materials for your next project.
Templates
Find a template to help you with your construction project tasks.
Material Price Tracker
Get the latest U.S. retail prices and view historical trends for common building materials.
Glossary
Explore key terms and phrases used in the industry.

