
Wouldn’t it be great to know if a project was behind schedule or over budget before the job was done? With an earned value report, teams can discover which tasks are behind schedule even at the start of a project — and which ones are over budget. Getting this information early in the project allows teams the chance to proactively control costs, rather than reacting at the end.
What is an earned value report?
An earned value report compares planned value (PV), earned value (EV), and actual cost (AC) of a project, providing a snapshot of the work progress in terms of budget and schedule. It allows teams to discover if a project is over budget or will be delayed early in the project — instead of waiting until the end to discover overruns and delays.
To produce the report, you will need to analyze each task in a project and determines its status. With this information, teams can get an overall picture of the project and better predict cost overages and potential delays.
Each task in the schedule needs to be analyzed for several key factors that influence the overall budget and schedule. Scheduling software, such as Microsoft Project, can help teams with this analysis and make reporting easier.
Read more: The Ultimate Guide to Construction Accounting
The 5 steps to creating an earned value report
Before beginning an earned value analysis, there are a few steps that need to be taken to ensure that the calculations can be made.
The project needs to be divided into tasks, each task must have a start and end date, each task must have a budget, and the earned value report needs to be run on a regular schedule. Most project teams do these tasks anyway as part of their schedule planning. A weekly or monthly review interval is probably best, depending on the length of the overall project.
Creating an earned value report involves performing several calculations on every task in the project schedule.
There are five steps to creating an earned value report:
- Gather performance information
- Determine schedule status
- Determine cost status
- Forecasting
- Reporting
1. Gather performance information
The first step is to gather information regarding the task. Preliminary information begins with the task name, start date, end date, and budget. After gathering information from the field regarding how much work has been completed, several calculations are performed to find key variables that are part of the analysis.
Budget at completion (BAC): This is the overall cost budget for the task.
Planned value (PV): This value is calculated by analyzing the start and completion dates for the task, calculating the percentage of the task that should be complete, and multiplying it by the budget (BAC). For example, if the task is scheduled to take 10 days and today is day three, the task should be 30% complete.
Multiply 30% by the budget at completion — let’s say $10,000 — and you get $3,000, or the value of the portion of the task that should be complete.
Earned value (EV): To calculate earned value, you need to know the percentage of scheduled work that you have already completed, and the budget at completion (BAC). Multiply the percent complete by the budget to get the earned value — in other words, the actual value that you’ve earned on the project to date.
For example, if the task is 50% complete and its budget is $10,000, the earned value is $5,000. There are many ways to measure the completed work, from percent complete to unit count, depending on the task.
Actual cost (AC): This is calculated by adding up the costs incurred to complete the task as of the current date, which can usually be found on a job cost report from the accounting system.
2. Determine schedule status
The next step is to analyze the schedule for each task. Two calculations are performed to determine whether the task is on schedule or not.
Schedule variance (SV): To determine if the task is ahead of schedule or behind, take the earned value (EV) of the task and subtract the planned value (PV). If the schedule variance is negative, the task is behind schedule. If it’s zero, the task is on schedule. If it’s positive, the task is ahead of schedule.
For example, if the earned value (actual amount completed) of the task is $5,000, and the planned value (estimated amount completed) is $3,000, the schedule variance is $2,000. This means the task is ahead of schedule by $2,000.
Calculation: SV = EV – PV
Schedule performance index (SPI): This calculation measures the efficiency of the work being performed on the task. It is calculated by taking the earned value (EV) and dividing it by the planned value (PV). If the answer is less than one, the task is behind schedule. If it’s zero, the task is on schedule. If it’s greater than one, the task is ahead of schedule. For example, using the task above the schedule performance index would be calculated by dividing $5,000 by $2,000, giving an answer of 2.5. This means that the task is ahead of schedule.
Calculation: SPI = EV / PV
Dig deeper: How to assess a schedule delay in construction
3. Determine cost status
Next, variables regarding the cost status are analyzed. Similar to the schedule analysis, there are two variables that are calculated.
Cost variance (CV): This calculation shows whether the task is over or under budget. It’s calculated by subtracting the actual costs (AC) from the earned value (EV). If the answer is negative, the task is over budget. If it’s zero, the task is on budget. If it’s positive, the task is under budget. For example, if the earned value of a task is $5,000, and actual costs are $4,500, the cost variance is -$500. This means the task is under budget by $500.
Calculation: CV = EV – AC
Cost performance index (CPI): This calculation determines the efficiency of the work being performed on the task. It’s calculated by taking the earned value (EV) and dividing it by actual costs (AC). If it’s less than one, the task is over budget. If it’s zero, the task is on budget. If it’s greater than one, the task is under budget. For example, an earned value of $5,000 divided by the actual costs of $4,500, give a CPI of 1.11.
Calculation: CPI = EV / AC
4. Forecasting
Once the calculations for schedule and cost have been completed for all tasks on the schedule, we can begin the process of forecasting. There are four additional calculations that help project teams predict the future performance of each task.
Estimate to complete (ETC): This is the estimated costs required to complete a task. It calculates only the future costs from this point forward, not the total costs for a task. It’s calculated by taking the budget at completion (BAC) for the task and subtracting the earned value (EV) and dividing that answer by the cost performance index (CPI). It can be based on the existing budget for the task or can be calculated using a revised budget value.
Calculation: ETC = (BAC – EV) / CPI
Estimate at completion (EAC): This is the total expected cost for the completion of a task. It’s calculated by adding actual costs (AC) to the estimate to complete (ETC).
Calculation: EAC = AC + ETC
Variance at completion (VAC): This calculation forecasts what the cost variance will be at the completion of the task. It’s the expected amount the task will be over or under budget. It is calculated by taking the budget at completion (BAC) and subtracting the estimate at completion (EAC).
Calculation: VAC = BAC – EAC
To complete performance index (TCPI): This calculation provides the efficiency level that the team will need to achieve in order to finish the task on time. It’s calculated by taking the budget at completion (BAC) and subtracting the earned value (EV) and dividing this result by the estimate at completion (EAC) minus actual costs (AC).
Calculation: TCPI = (BAC – EV) / (BAC – AC)
How to use the information from earned value reporting
Once all the calculations have been completed for each task on the schedule, a detailed report can be created. Overall project calculations can be completed based on task values, giving the project team an overall look at the schedule and budget variances. Using this information teams can update cost estimates and schedules to include the realities of the project.
Teams can also assess where schedule and cost problems are occurring in an attempt to address them through improved efficiency. Individual tasks can be analyzed and reviewed to determine why the task is over budget or behind schedule. Lessons learned from these investigations can be transferred to other projects or used later on.
Earned Value Report example
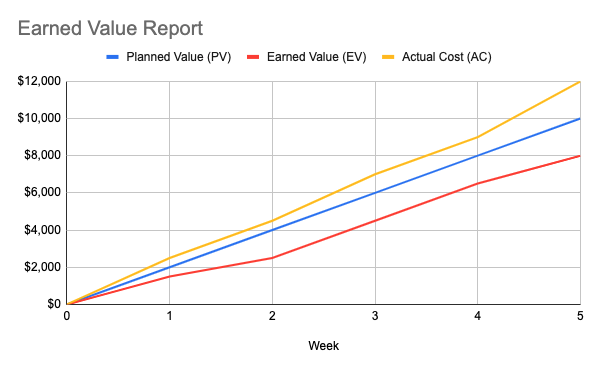
In this example, the earned value report shows that the project is over budget and behind schedule. At Week 3, the planned value is $6,000, but the earned value is only $4,500. As a result, the schedule variance is -$1,500. With an actual cost of $7,000 in Week 3, the cost variance shows that the project is over budget by $1,000.
Earned value: Another tool in your toolbox
Many contractors assess their projects based on gut feelings or final cost reports. But this isn’t accurate — and only lets teams know when there’s a problem at the end of a project.
By analyzing costs and schedules during the project, teams can actively address delays and cost overruns before the project is finished. They can also respond to issues on the project more quickly when they are identified sooner.